


Dashboard
By clicking on the 'Dashboard' option on the menu, you will be provided with the graphical interface of the overall performance.
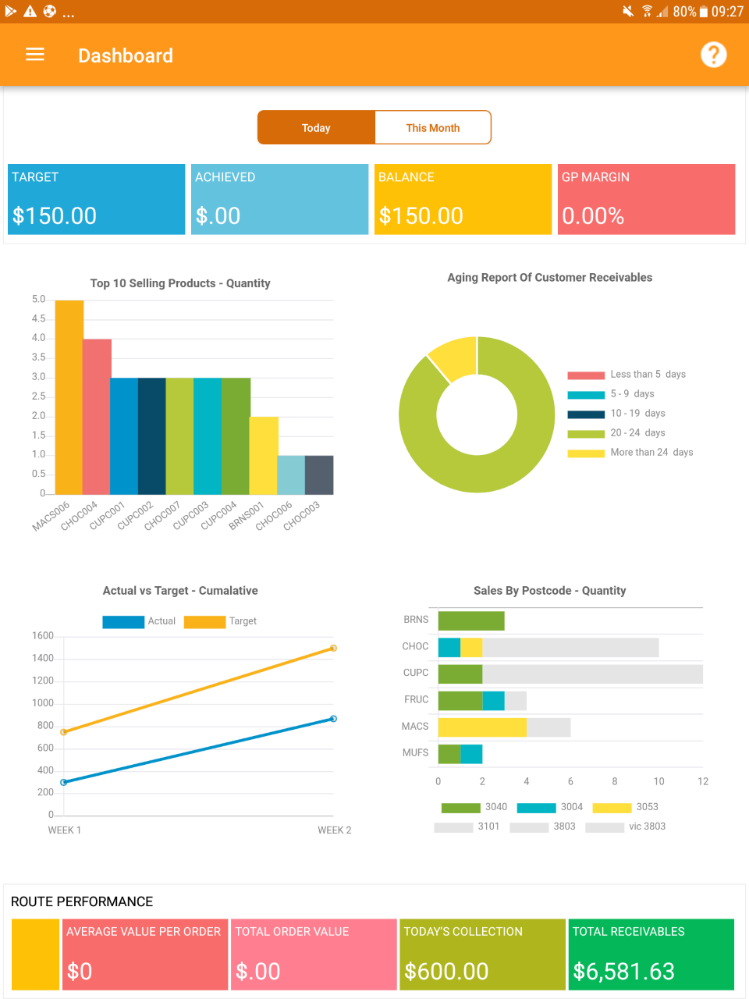
User Performance
At a the top users can view the key performance indicators in real time such a the rep sales targets, orders created, Difference between target and current value as well as GP margin.
Overall Sales
These are graphical reports that indicate the overall sales performance breaking them down into Top 10 Selling Products, Aging Report of Customer Receivables, Actual vs Target – Cumulative as well as Sales by Postcode.
Route Performance
This live data is displayed at the bottom of the screen and is broken down in to important sales statistics such as route coverage, lines per order, Productive calls, Average value per order, Total order value, Todays collection and total receivables.